
By: Susan Birch, Intro to GIS Student
“Protecting Marine Mammals in Crowded Water” is the second prize winner of the 2018 ESRI Storytelling with Maps Contest in the category of Conservation, Environment, and Sustainability. With the objective to illustrate efforts aimed at protecting the planet’s natural environments and ensuring a sustainable future for mankind, this ECOPOTENTIAL project is explained through text, video imagery, photographs and GIS generated maps. The project focuses on the Pelagos Sanctuary for Mediterranean Marine Mammals in the waters between mainland France, Italy and the island of Corsica.
This 87,000 square kilometer area is a high level primary productivity area, meaning lots of food is produced at the bottom of the food chain, which attracts whales and dolphins. These large and long- lived keystone species have a disproportionately large influence on their ecosystem. ECOPOTENTIAL created this story map to communicate a vast and diverse amount of information needed to understand the dynamics of the sanctuary. Using the tools of satellite technology, ground measures and ecological monitoring, data was accumulated over a four-year span. The work is presented in sections that explain the two steps they are taking to reach this goal.
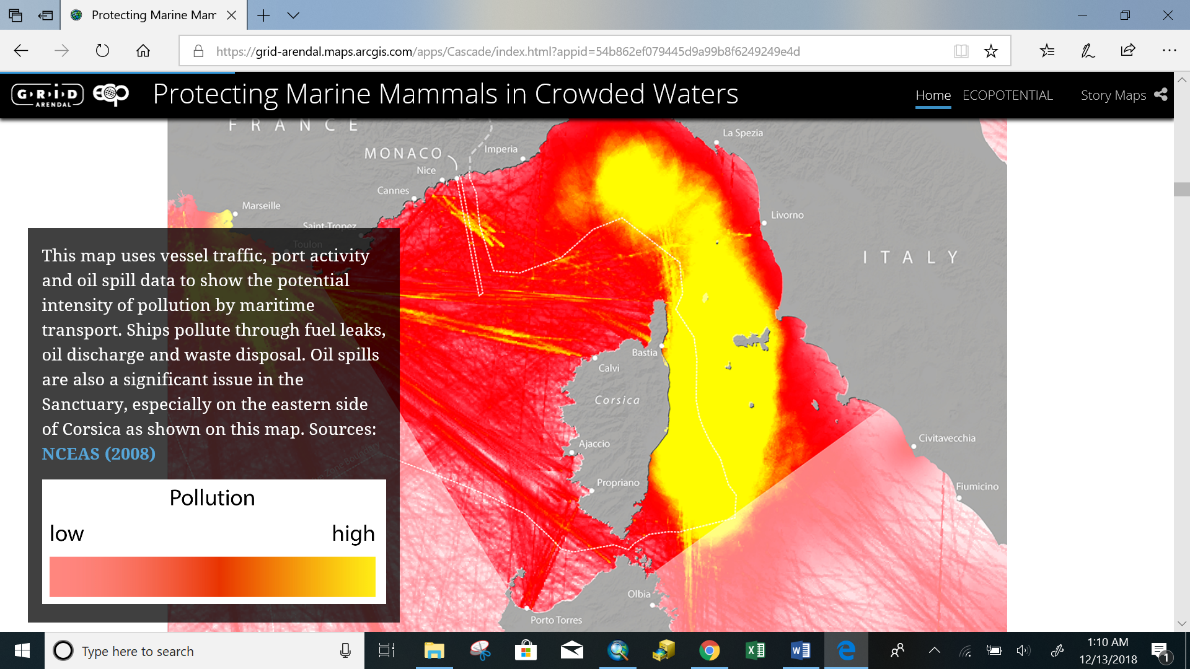
The viewer first views a topographic raster map showing the sanctuary area. The same base map is next shown, now presenting the pollution intensity in the region which is due to oil spills, fuel leaks, and waste disposal in these waters. The cartographer uses a color ramp to highlight this negative human activity.
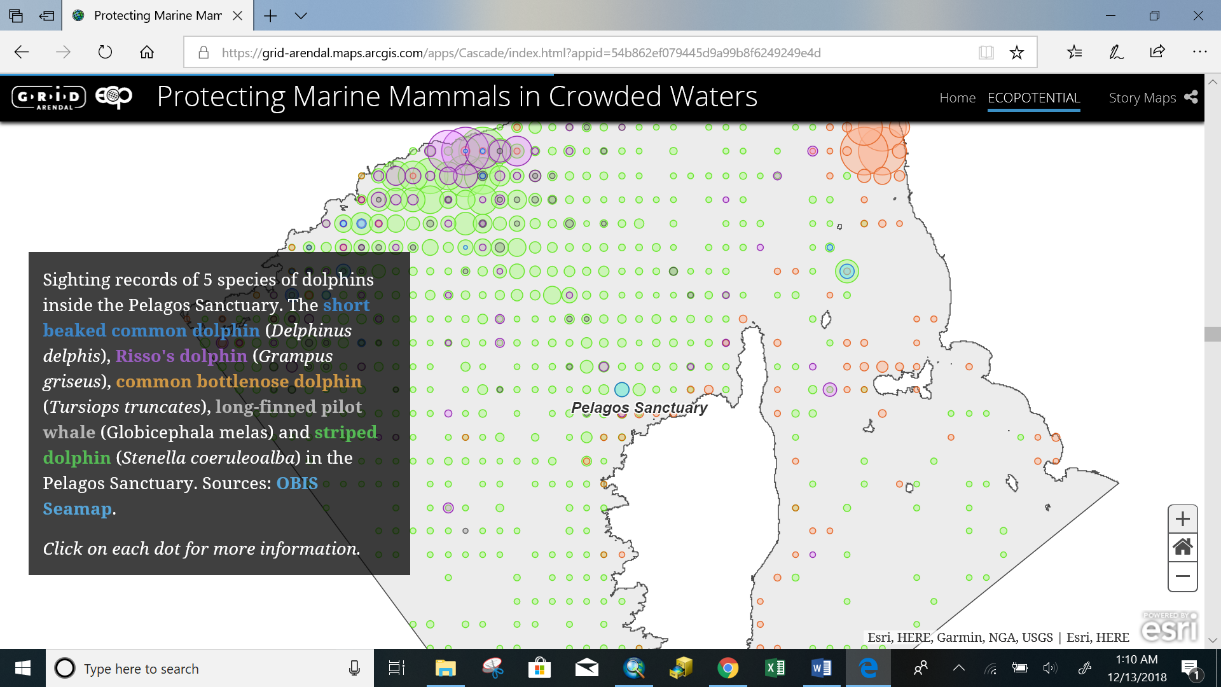
The first step for ECOPOTENTIAL is predicting the location of marine mammals. Two maps are presented: one from data collected by boat surveys of sightings of three whale species in the sanctuary. The viewer sees dot symbols placed at locations of sightings that are color-coded by species. Clicking on a dot brings up a data box listing the number of individuals sighted. There is a second map, of similar design, showing dolphin sightings.
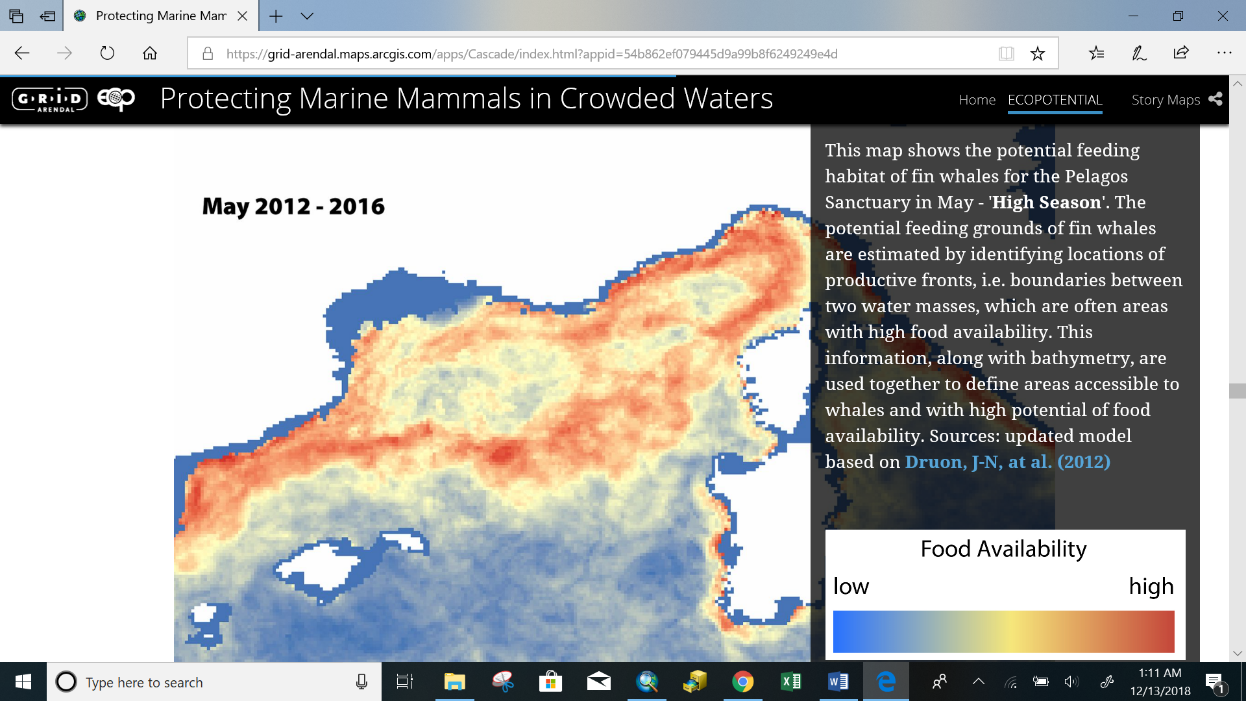
The second step of the project is ecological monitoring. Data collected over a four-year span is shown in a map of potential feeding grounds. A color ramp is used to show low-to-high food availability during high season. A second similarly design map displays data for low season food availability.
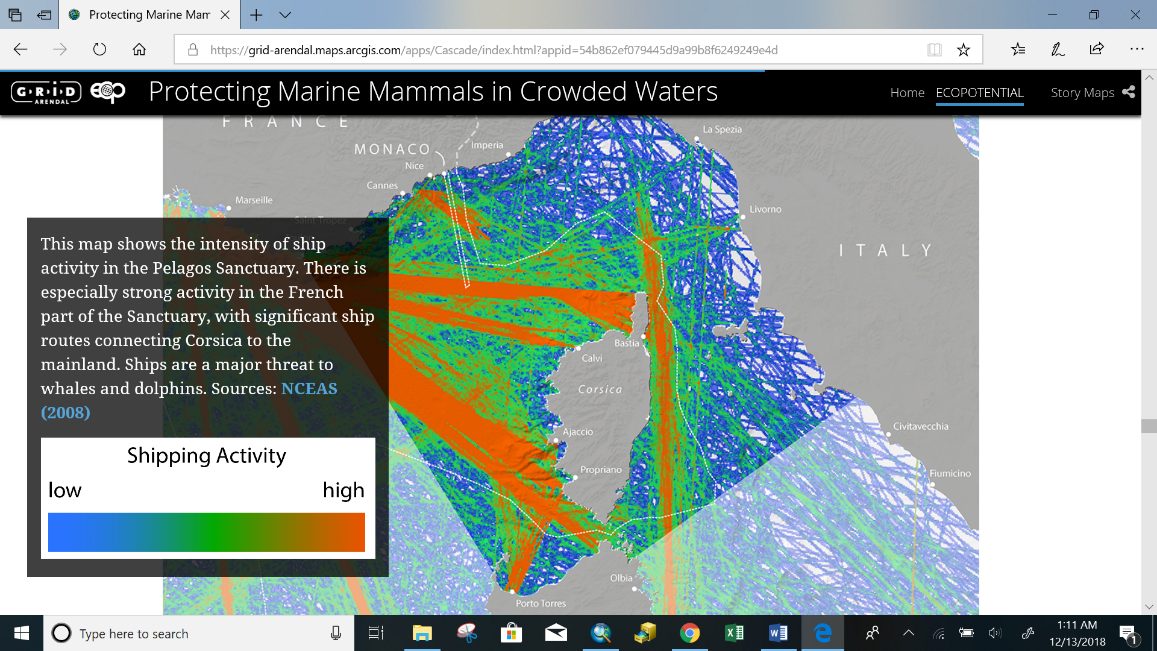
Because human activities have potentially significant impacts on the area, mapping of the intensity of ship activity in the sanctuary is included.
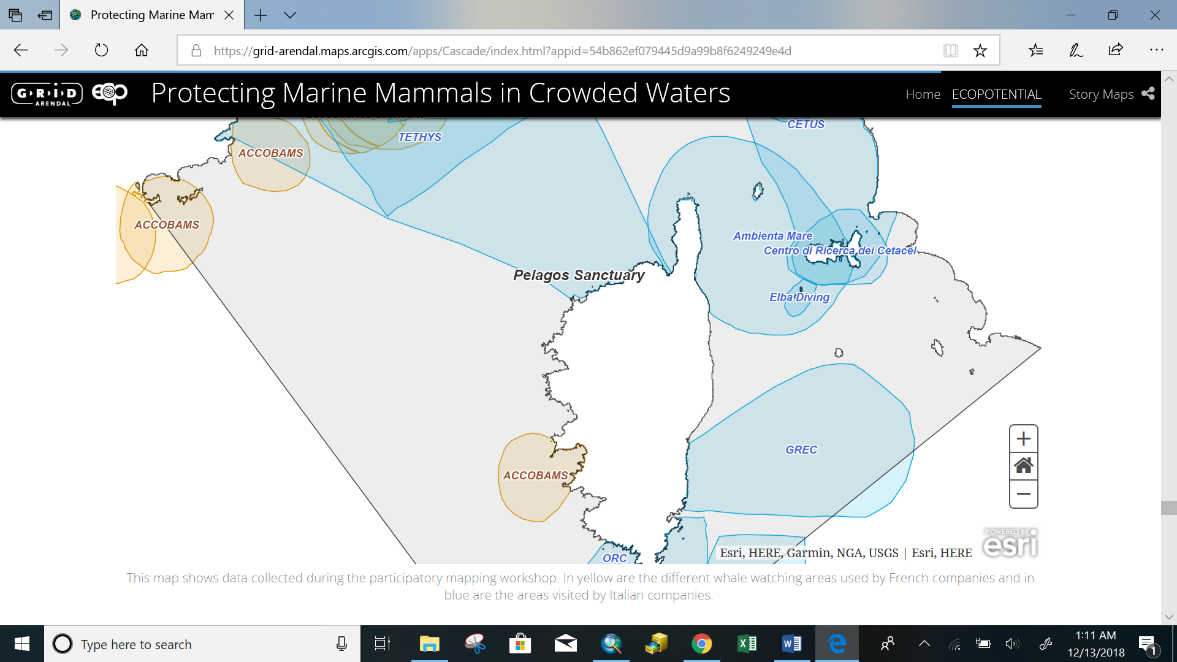
The following map shows whale watching areas used by the French and Italian tourism markets.
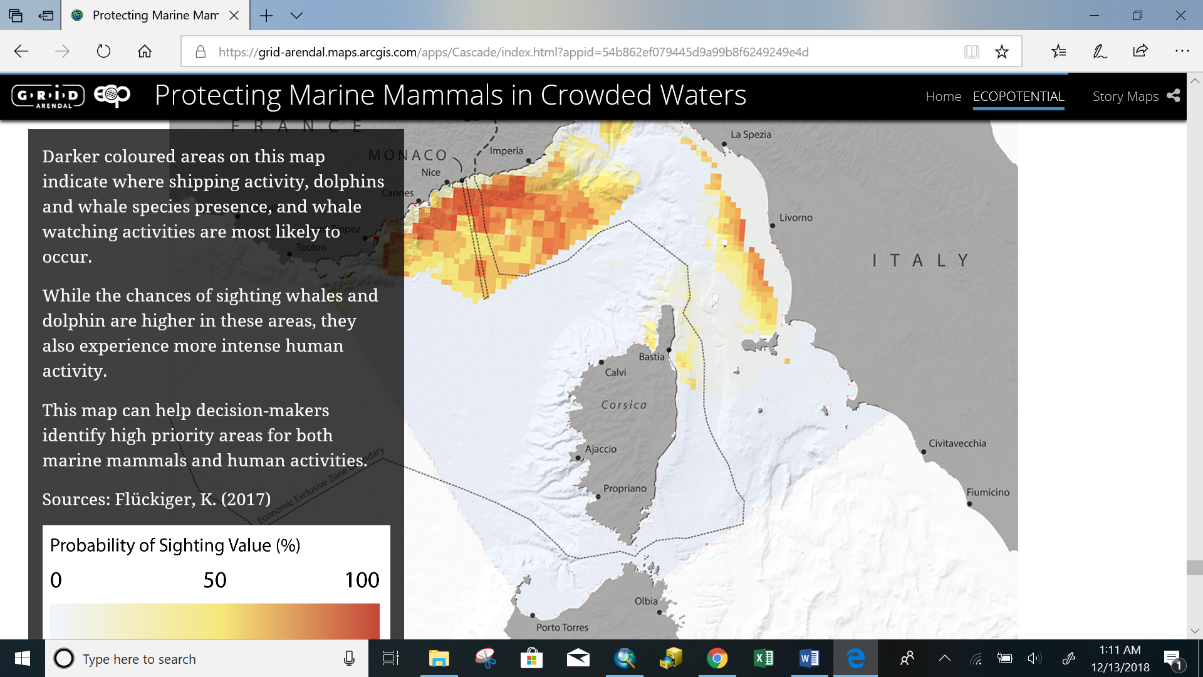
A final map shows the probably of whale sightings, areas where shipping, marine mammal presence and where whale watching activities most likely occur. By raising public awareness and understanding of human interaction with the environment the ECOPOTENTIAL project hopes to build support for their goals.
Due to the amount and diversity of the information needed to understand the dynamics of the Pelagos Sanctuary, the project uses maps as visual tools to clearly convey complex information. The author notes the use of Bayesian Belief Networking, a statistical method, to map the area.
Scientists and environmental organizations are seeking targeted measures within the Pelagos Sanctuary for Marine Mammals that would usually be in place in any marine protected area. These proposed measures include the development and implementation of both specific management actions and research. This story telling project is part of ECOPOTENTIAL’s effort to understand, quantify and reduce human impact on the animals and ecosystems present.